SumUp's journey from reactive to proactive Data Quality Monitoring

Written by Mirjana Marinkovic and Ajay Kumar Muppuri
In the Data Platform team, we aim to provide our stakeholders with high quality data that can be completely trusted. In order to achieve this, we built a data quality framework, which is being used currently by our data marts in Snowflake.

In this blog post, we want to share our journey on how we moved from reactive Data Quality Monitoring in our “legacy” Postgres DWH to a more proactive approach in our new Snowflake DWH.
History
Data Quality monitoring at Sumup started in 2020. as part of everyday processes in the Data team. In order to support the decision-making process based on data, Data Quality Framework was introduced and implemented in the central DWH, stored in relational DBMS based on PostgreSQL technology. Here are some major steps in the Framework implementation:
Early “ad-hoc” stage: numerous data issues were discovered through remarks we got from our users. Tracking and discovering were based on ad-hoc analysis. Even though it can be considered as a “chaotic period”, this phase helped us to get to know the data in our system and the issues that we had. We also learned a lot about the business, their needs, and what data points are more important than others. All of this led to the second phase of the Framework implementation:
The second “setting the pillars” phase. The knowledge we gained in the previous phase served us to set up some data quality pillars and definitions:
Definition of Data Quality. This helped us to answer questions of what is the data quality at Sumup and its scope.
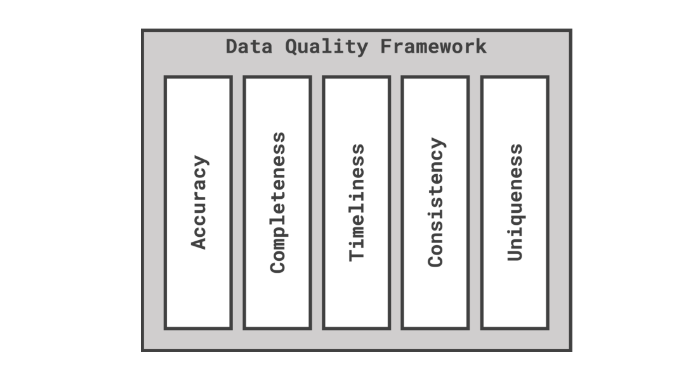
Data Quality dimensions. What are we trying to measure? Several dimensions were agreed to be measured and tracked: Timeliness, Completeness, Uniqueness, Consistency, Validity, and Accuracy.
Documenting and tracking the issues - using tickets and various labels The necessity of this phase wasn’t questioned at all, but the users didn’t feel the benefits of the whole story, yet.
The third “monitoring” phase. After setting the pillars, we started to understand our issues better. It enabled us to implement a monitoring system that tracks the company's main KPIs. To achieve that, we used SQL and Tableau for the issues visualizations. For the first time, the team started to notice the issues before the users, but this was still a semi-manual way of working. Someone has to analyze the dashboards on a daily basis and maintenance of the whole system was time-consuming. A huge step forward has been made in comparison with the first phase, but in the longer term, it wasn’t considered a sustainable solution. On top of that, with the company's growth, a data explosion was happening and PostgreSQL technology couldn’t follow that trend anymore. In the next chapter, we will talk more about the system migration to Snowflake and what opportunities for further improvements we used with the modern technology.
New Architecture in Snowflake
DWH migration on Snowflake gave us the opportunity to make certain improvements in various parts of our data platform. Cloud technology, columnar data warehousing, and other new features inspired us to tackle and improve processes within the data warehouse, from access to development, including the upgrade of data modeling. Finally, data quality also found its space in this progression train. The main goal was to automate the framework as much as possible and to make the whole process more proactive and less human-dependent. Main elements of the new architecture:
Established Data Quality framework
Data Quality dashboards for monitoring


Two elements are kept from the previous architecture: the framework was already good enough theoretically but its realization required a new approach.
The main actor became a part of the pipeline that executes a set of controls at the end of each Airflow DAG.
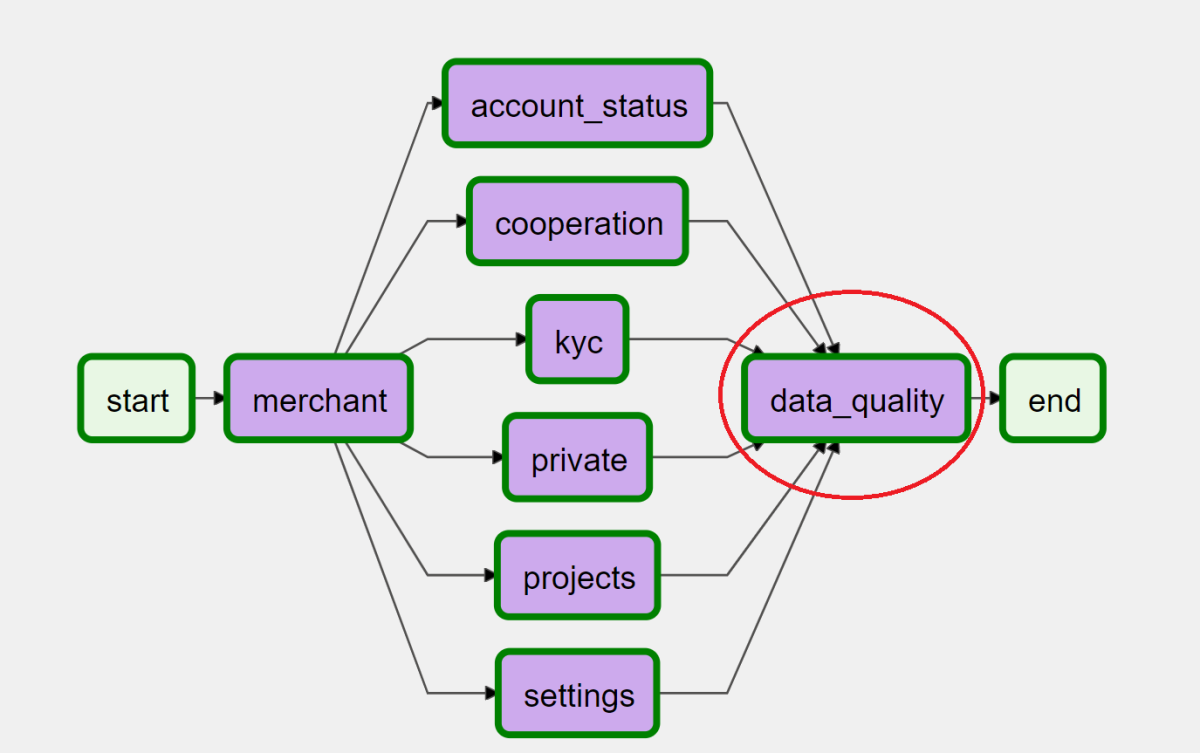
The core part of this step is the Data Quality Operator( detailed explanation in the next step) which processes a group of data quality checks using SQL. Every control is documented and related to one of the framework’s dimensions (accuracy, uniqueness, etc.). Each SQL control is structured in a way that no rows shouldn’t be returned if the data are correct. If there is such inconsistency and SQL returns at least 1 row, DAG will have failed status and the team will be notified in a slack. There are currently 65 automated controls that are running every day in our data marts.
The new setup forced us to establish the process in case the DQ step failed:
The team gets notifications on Slack:
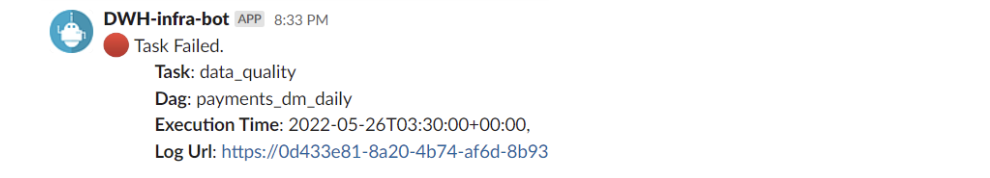
Once we have the alert, a team member can react to the notification, and would investigate the issue.

As you can see from this new setup, our stakeholders no need to inform us when there are data quality issues, which was unfortunately true in our previous setup. That’s the core of a reactive vs. proactive data quality system.
Data Quality Operator
In order to make Data Quality as a first class citizen of our pipelines, it was important that we keep the following things in mind:
Easy to add new Data Quality tests.
Alert on Data Quality test failures.
Automated running of Data Quality as part of the pipeline.
We did this by building a Data Quality Airflow Operator. This operator was based on a very simple rule - execute a SQL query and if the query returns any rows, fail the task and alert. As you can see now, this operator is built of 2 parts:
SQL Query which are basically the checks we want to run
Operator that executes the above SQL Query and decides whether the task has run successfully or not.
Here is an example the function that executes the query:

Sample Data Quality check:

Having this kind of a structure has allowed any stakeholder to add DQ controls easily if needed.
Conclusion and Future Work
This Data Quality Control is now a first class citizen of our pipelines which has really helped us improve the overall quality of the data that we produce. But as you can see, this is only done at the final presentation layer, but in the future, we also want to do this for the raw/staging layer.
Thank you all for reading this post.